“`html
How to Find Slope Effectively: A Practical Guide for 2025
The concept of slope is essential across various fields, including mathematics, engineering, and physics. Understanding how to find slope effectively can enhance your skills in solving problems related to linear equations, graph analysis, and real-world applications. This guide will explore the slope formula, methods for calculating slope, and practical examples to solidify your understanding of finding slope in different scenarios.
Understanding Slope and Its Importance
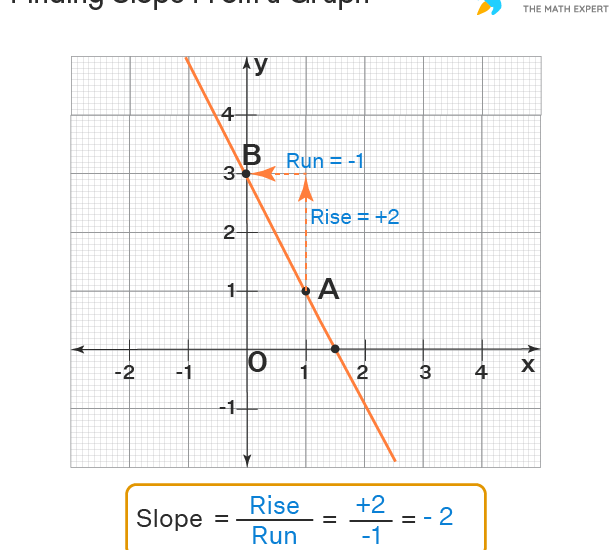
The term slope refers to the steepness or incline of a line, often described as the ratio of rise over run. In mathematical terms, the slope of a line is calculated using a simple formula: the change in vertical distance (rise) divided by the change in horizontal distance (run). This concept is fundamental in fields like engineering, physics, and economics, where understanding trends and relationships is critical.
Definition of Slope
The slope definition is not only a mathematical concept but also a practical tool in various disciplines. Essentially, slope quantifies the rate at which one quantity changes concerning another. Mathematically, the slope formula is expressed as m = (y2 – y1) / (x2 – x1), where (x1, y1) and (x2, y2) are two points on the line. The rise is the difference in the y-coordinates, while the run is the difference in the x-coordinates.
Types of Slope
There are three primary types of slope: positive slope, negative slope, and zero slope. A positive slope indicates that as one variable increases, the other also increases, representing an upward trend. Conversely, a negative slope shows a downward trend, where an increase in one variable corresponds to a decrease in the other. Understanding these types allows for effective slope comparisons in data analysis.
Real-Life Applications of Slope
Slope is not confined to mathematical graphs; its application spreads into real-life scenarios, enhancing understanding through practical slope measurements. For instance, in construction, slope plays a critical role in drainage design, ensuring water flows away from buildings or roads. In physics, slope assists in analyzing motion and speed. Moreover, slope in statistics helps in understanding relationships between data variables and can be visualized through interactive slope graphs.
How to Calculate Slope: A Step-by-Step Guide
Calculating slope can initially seem challenging, but breaking it down into steps simplifies the process. Here are the essential steps involved in finding slope between two points.
Step 1: Identify Your Points
Begin by selecting two points from your graph or linear equation. For example, suppose you have points A (2, 3) and B (5, 11). Here, the x-coordinates are 2 and 5, while the y-coordinates are 3 and 11. These points will serve as your reference to calculate slope.
Step 2: Apply the Slope Formula
Utilize the slope formula by plugging your points into it. Substituting in the coordinates from Step 1: m = (11 – 3) / (5 – 2). Simplifying this, we find slope, which equals to 8 / 3. Thus, the slope between points A and B is 8/3, indicating a steep line that rises quickly.
Step 3: Interpret the Slope
After determining the numerical slope, it’s essential to interpret it within context. A slope of 8/3 informs you how quickly y increases relative to x. For practical examples, if you’re analyzing economic data where one represents sales and one represents time, this number reflects how sales grow over time. Understanding this slope meaning is crucial for applying mathematical concepts to real-world scenarios.
Graphical Representation of Slope
Graphing is a powerful method for visualizing slope, allowing for a clearer understanding of its implications. When plotted, the slope of a line indicates strength and direction while revealing relationships between the variables involved. Below, we’ll explore how to represent slope on a graph.
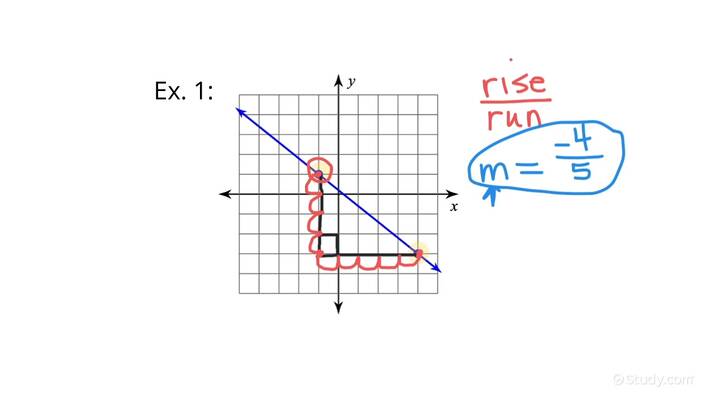
Constructing a Slope Triangle
A slope triangle is useful for visualizing slope on a graph. By drawing a right triangle on the graph, where the vertical side represents rise and the horizontal side represents run, you can visually demonstrate the concept. For instance, connecting point A to point B creates a triangle with legs equal to the rise (8) and the run (3). This triangle outlines the relationship visually, enhancing comprehension of steepness.
Using Interactive Slope Graphs
Interactive slope graphs are excellent educational tools that allow learners to manipulate points and instantly view changes in slope. By dragging points, users observe how varying coordinates alter the slope value, facilitating deeper understanding. Such tools can enhance lessons in various settings, from classrooms to online tutorials.
Examining Different Slopes
Different types of slopes can be analyzed using graphs. For example, a horizontal line represents a slope of 0, indicating that the y-value remains constant regardless of the x-value. On the other hand, a vertical line is technically undefined as no change in y (rise) occurs regardless of x (run). Recognizing these distinctions in a graphical format enriches the comprehension of slope and its mathematical properties.
Common Slope Problems and Solutions
To master slope calculations, engaging in practical slope problems solving is crucial. Below are some overarching themes and examples of slope quiz questions you might encounter.
Slope Word Problems
Word problems are an effective method to apply your understanding of slope in math. Consider this scenario: A car travels at a constant speed, increasing in height. If it travels vertically up 150 meters over a distance of 300 meters horizontally, what is the slope? Using the slope formula, we find the slope to be 150/300 = 0.5, indicating that for every meter traveled horizontally, the car ascends half a meter.
Slope Practice Problems
Another way to improve is through slope practice problems. Take the following points: C (1, 5) and D (4, 7). What is the slope between these two points? Using the slope definition again leads us to (7 – 5)/(4 – 1) = 2/3. Practicing various scenarios supports steady growth in slope comprehension.
Analyzing Linear Functions
<pUnderstanding the relationship between slope and linear functions is pivotal. Use various equations, such as y = mx + b, where m represents the slope, to illustrate how changing m affects the line. A larger m results in a steeper line, while a negative m reflects a decreasing trend. Observing this relationship through practice problems enhances learning and ensures solidification of concepts.
Key Takeaways
- The slope is a critical concept involving the ratio of vertical change to horizontal change.
- Calculating slope can be simplified through systematic steps—identifying points, applying the slope formula, and interpreting results.
- Visual tools such as slope triangles and interactive graphs enhance understanding.
- Practical applications of slope can be observed across diverse fields, from engineering to economics.
FAQ
1. What is the general slope formula?
The general slope formula is expressed as m = (y2 – y1) / (x2 – x1). It calculates the slope using the difference between the y-coordinates (rise) divided by the difference between the x-coordinates (run).
2. How can slope be applied in construction?
In construction, slope is essential in determining the angle of roofs, drainage systems, and wheelchair access ramps. Ensuring the correct slope enhances functionality and complies with safety standards.
3. How does slope change affect linear functions?
Slope changes in linear functions denote shifts in trend direction and steepness. For example, an increase in slope indicates more pronounced rises (or declines), showcasing a stronger relationship between the variables involved.
4. What are real-life examples of slope?
Real-life examples of slope include roads that slope for drainage, graphs of financial trends, and physics equations representing speed and elevation changes. Each instance showcases the practical utility of understanding slope.
5. Can I find slope using a calculator?
Yes, several slope calculators exist online and in software applications that can compute slope through manual inputs of coordinates or formulas, streamlining the slope finding process.

“`