Effective Ways to Find the Range of Data in 2025: Understand, Analyze, and Succeed!
Understanding Range in Statistics
The concept of **range** in statistics is fundamental for anyone involved in data analysis. The **range of values** is calculated as the difference between the maximum and minimum values in a dataset. This statistical measure provides important insights into the overall distribution and variability of the data. Understanding the **importance of range** can help researchers identify trends, anomalies, and variations within a dataset. By examining the range, analysts can draw conclusions about the spread of the data which ultimately influences decision-making processes across various fields including finance, science, and business.
The Basics of Range Calculation
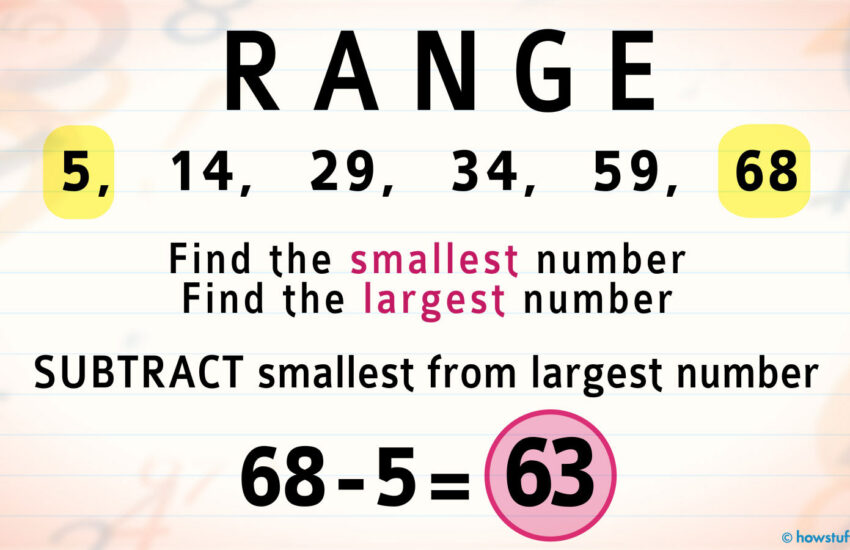
To **calculate range**, one simply needs to follow the basic **range formula**: Range = Maximum Value – Minimum Value. For example, if we have a data set of exam scores: 70, 85, 60, 90, and 75, the range would be calculated by identifying the maximum score (90) and the minimum score (60). Thus, the range is 90 – 60 = 30. This is a straightforward yet powerful method to assess data variability, especially valuable in fields like **quantitative research** where understanding spreads of data is crucial. Make sure to familiarize yourself with the **range calculation methods** to ensure generosity in your data representation.
Advanced Range Calculation Techniques
For more complex datasets, analysts may use **advanced range calculation** techniques such as considering **interquartile range (IQR)**, which provides a more robust measure by focusing on the central 50% of the data. This method is particularly beneficial in detecting outliers, as extreme values can skew the standard range calculation. By employing IQR, researchers can develop a clearer picture of the data’s overall structure. Additionally, graphical representations like **box plots** offer a visual method for constructing range assessments, highlighting potential outliers and the spread of data effectively.
Visualizing Range for Better Data Analysis
Creating **range charts** is essential for **visualizing range** within datasets. Utilizing scatter plots or box plots allows for a clearer interpretation of data spread and comparisons. For example, if you are comparing the scores of two different classes using a box plot, you not only see the overall range but also the median, quartiles, and any potential outliers. This visual aspect of **range analysis** makes it easier to present findings to stakeholders, ensuring a comprehensive understanding of variability and statistical distributions in data presentations.
Range Measurement Methods
Beyond calculating range, the **measurement techniques** one employs can influence the analytical outcomes significantly. Different methods yield varying insights; for instance, evaluating the **absolute range** versus the **empirical range** may lead to different interpretations in statistical contexts.
Range Comparison Techniques
When analyzing data, **range comparison** can be critical. For example, consider two datasets representing sales figures from different quarters. By calculating the ranges, businesses can identify which quarter displayed more variability. Suppose Quarter 1 has a range of 300, while Quarter 2 has a range of 150; this signifies that Quarter 1 experienced higher and lower sales figures than Quarter 2. This range comparison can uncover underlying issues directly related to sales strategies or external market conditions, laying the groundwork for potential improvements in business strategies.
Understanding Range Indicators
Effective **range analysis** involves the understanding of various **range indicators** that can assist analysts in data interpretation. Indicators such as median and mode, when assessed alongside the range, provide a deeper insight into the data’s structure. For instance, while the range highlights variability, understanding the median can indicate the “middle” of the data, offering additional perspective on overall trends. Analysts should leverage all indicators together for a comprehensive understanding.
The Practical Implications of Range Analysis
The **importance of range** extends into practical **range applications** across industries. In healthcare, for example, understanding vital sign ranges can aid in diagnosing conditions. Similarly, in education, analyzing the range of student scores can inform teaching strategies. Regular assessments of the data range are instrumental in performance evaluations, allowing for data-backed decisions that can influence curriculum design or training methods. By continuous monitoring and evaluation of the range, organizations stand to gain from significant insights that promote improvement and efficiency.
Finding Ranges in Math
When dealing with mathematics, understanding **finding ranges in math** involves a blend of statistical principles and practical calculations. The concept of range is essential not just in statistics but also for algebra, algebraic functions, and various mathematical modeling scenarios.
Demystifying Range for Educational Purposes
Educators often rely on hands-on methods to ensure students correctly understand how to **find the range** of data. Introducing students to real-world datasets can facilitate practical understanding. For example, consider asking students to find the range of daily temperatures for a week, reinforcing practical experience in tackling **range calculation methods**. Providing students the opportunity to visualize the data on a number line can further solidify their understanding of **range** and its significance.
Range in Classifying Statistical Data
Classifying statistical data based on **range** deepens one’s analytical capabilities. By teaching students about the differences in data categories (discrete vs. continuous), they can discern when to correctly apply range calculations. This rigorous approach promotes analytical skills vital for fields requiring data interpretation, such as economics or psychology.
Case Studies on Effective Range Use
Employing **real-world examples** of **range calculations** assists in driving home concepts. Suppose new product lines are introduced within a company, analyzing the range of sales pre- and post-launch can yield significant insights into consumer behavior and market acceptance. By understanding how distributions have shifted in the range, companies can adjust strategies for maximum effectiveness. Such case studies underscore the broad applications of the range, preparing students or professionals for comprehensive data analysis in their future careers.
Key Takeaways
1. Understanding range is crucial for analyzing data variability and distribution.
2. The basic range formula is simple yet powerful: Max – Min.
3. Advanced range calculation methods like IQR provide more reliability in certain datasets.
4. Visualization techniques such as box plots can enhance understanding and representation of the range in statistics.
5. Real-world applications of range measurements can significantly impact decision-making processes across various fields.
FAQ
1. How do you calculate the range of a dataset?
To calculate the range of a dataset, subtract the minimum value from the maximum value. For example, in the dataset {5, 10, 15, 20}, the range is 20 – 5 = 15.
2. What is the significance of the range in statistical analysis?
The range indicates how spread out the values in a dataset are, offering insights into variability. A higher range suggests greater variability, which can influence analysis and interpretations significantly.
3. Can the range be affected by outliers?
Yes, the presence of outliers can drastically impact the range. Outliers increase the maximum or decrease the minimum value, thereby expanding the range and potentially skewing analytical outcomes.
4. What other measures are used alongside range in data interpretation?
Besides range, common measures include mean, median, variance, and standard deviation. These provide a more rounded understanding of a dataset’s characteristics and distribution.
5. How does range apply in real-world data analysis?
Range can reveal trends and anomalies in datasets, guiding decisions in fields like marketing, finance, and healthcare. By understanding range, organizations can better respond to data-driven insights and market demands.